

Small businesses typically allocate between 8% and 18% of revenue for marketing depending on how aggressively they want to grow(Deloitte). It’s important to ensure that you make every dollar count when trying to grow your business. This is why data analytics is necessary for marketing-led business growth.
Data analytics collection and reviewing is the only way to know if your marketing programs are working and if your spending is adequate. When marketing tactics are working, data analytics is also going to tell you what to optimize so you can reallocate your budget to the right parts of your marketing efforts. Collecting and reviewing data protects your marketing investment.
Let’s go through a deeper understanding of how this works, and why it’s important. Then we will share what tools we use and what we track so that you can optimize your marketing with data analytics.
Why Is Data Analytics Necessary For Marketing?
Data analytics is one of the most important parts of your marketing program and is often overlooked. The only way to determine if your marketing is working is to collect data and review it.
Deciding that a tactic is working or not based on arbitrary anecdotal evidence like a single phone call or sale will lead to overspending in marketing or worse turning off a marketing tactic that is performing well but on the surface isn’t easily seen.
Often times business owners will ask their marketers; how is our website performing? Are our emails getting opened? Where are the phone calls coming from? These questions are all answered by data analytics.
Let’s look at an example of how this works. If part of your marketing strategy is to increase sales from existing customers by cross-promoting additional/new services to existing customers the best way to do this is with an email marketing campaign.
In this example, you want to collect data analytics on email sends, open rates, and click-through rates and tie that back to new purchases from existing customers from your sales management system. If you are using a system like MailChimp or Constant Contact for your email marketing this type of reporting comes with all their packages and is easy to review.
After reviewing your reports if you are seeing good open rates (10% or more) then you know that the headlines are working. If click-through rates on your product offerings is 1% or more then your offers are being displayed well in the email.
If either of these is lower than the average listed above then you have some campaign tweaking to do to your email subject lines. Also, you need to review the language for your services and where they are placed in the email. Performing A/B testing for one element at a time will help you optimize content language and placement.
How Data Analytics Helps Business Growth
Data analytics allows you to look into the future a bit by reviewing what has happened in the past. Larger companies look at previous years’ data to predict future sales and create sales projections. Sales projections plus marketing data analytics will help you understand what you need to spend on marketing to meet sales projections.
Sales projections are not only for sales growth targets but for manufacturing and supple ordering projections as well. You can’t sell what you don’t have.
If you are an eCommerce retailer who has been in business for more than a year, you can use your previous year’s data to set sales projections and manage supplies. Good sales growth goals is between 5% and 10% (stockopedia) This level of growth allows you to grow comfortably without the growing pains of significant increases in short amounts of time.
Here is an example of how you can implement a sales growth strategy. Look at sales for your biggest selling season from the previous year and add 5 – 10% increase in sales based on what you are comfortable with. Then look at your marketing tactics and see where the majority of your sales came from during that time frame. Start with increasing your marketing spend in the areas that had the most leads during your previous selling season. Monitor your reports to see if any new lines of acquisition emerge as well as test new lines of advertising to see if you can increase sales.
If your Google Digital Shopping Ads have been your biggest sales generator increase your budget by 5%, then consider trying a new advertising channel like Youtube Video Ads with the other 5% increase to see if you can increase sales during the season.
Reinforcing what works while testing new campaigns is a good mix for sales growth. Just make sure to monitor your data analytics reports for all campaigns to see how they are working.
Data Analytics Improves Marketing Strategy
When you create your marketing strategy you should also decide what data analytics metrics you want to track to see if you are reaching your business goals. Then for each marketing tactic, you need to figure out which metrics you need to track in order to assess whether a tactic is having a positive effect on your marketing goals.
Marketing strategies should ideally be set based on existing data analytics. Many new businesses don’t have existing data to work with so they need to rely on industry benchmarks and best practices to create an initial marketing plan and goals.
Once your initial marketing strategy and tactics have been created and implemented, use data analytics to refine and change based on your actual metrics. We recommend you start reviewing data within a few weeks of implementing any tactic just to give the data time to grow. We don’t recommend you make any changes to your tactics for at least 3 months so you can start to see trends.
If you recently launched a new website you will want to track traffic to the website and where it is coming from. Google Analytics is the best tool for this. It is provided free from google and tracks a lot of data. To start, track your overall traffic on a monthly basis and the source of the traffic. Did traffic come from search, your ads, or from social media? All of this is broken down in the report.
To determine if you are getting enough traffic in your first year of business look for industry benchmarks for what you should expect. Content Square publishes a digital experience benchmark report by industry to help you understand where you are relative to your industry to see if you are getting enough traffic.
When you look at the source of your traffic you should be seeing any sites that you are campaigning on. If you have social media campaigns running then some of your source traffic should be coming from your social media channels. If you are running digital ad campaigns you should be seeing paid traffic sources on the google analytics report as well. You may find traffic from other organic sources. These new sources are worth looking at to see if you should be putting content there or doing paid advertising to increase traffic from that source.
Data Analytics Marketing Metrics to Track
There is so much data available for marketing that it can be overwhelming to figure out what metrics are important for you to pay attention to and monitor. Tools like Google Analytics are designed to be used for very small service-based websites to very large eCommerce websites with many outbound campaign tactics that need to be tracked.
If you are just starting out with collecting and reviewing data analytics start with the basics. Then once you start asking more questions after reviewing the data you can add more data to your reports to answer those new questions.
For example, if you are running digital ads on Google you will want to know how many people have clicked on your ad to your landing page based on how many impressions were purchased for a month. Once you understand the click-through rate, you may ask yourself “how many of those people called us after they clicked through?” this is where you want to start tracking telephone conversions to see how many people who clicked through from the ad then took some other action on your website like click to call.
Here is a table that gives you the basic metrics you want to track initially by the most common marketing tactics used across a broad range of industries.
| Marketing Tactic | Data Analytics Metrics To Track |
| Website Service Based | Unique Users Total Page Views Bounce Rate Source/Referral Traffic SourceLead Events: Telephone call, Contact Form, Newsletter Signup, Scheduling An Appointment |
| Website e-Commerce | Unique Users Total Page Views Bounce Rate Source/Referral Traffic Source Product Sales By RevenueList of Items Sold Channel if applicable Abandon Cart Rate and Recovery |
| Google My Business | Search Impressions Telephone Calls Direction lookup (if you have clients come to your location) Schedule An Appointment Products viewed |
| Digital Advertising – any ad platform including google and social media platforms that offer Paid Advertising | Impressions Click Thru CountVideo Views (if running video ads) Conversions For Service Business – Telephone Call, Contact Form Submission, Email Sign Up, Schedule An Appointment Conversions for eCommerce – product purchase, email sign up |
| Email Marketing | Size of email list +- each month Total emails sent Unique Opens Clicks and what they clicked on Names of People who opened most often |
| Search Engine Optimization | Search Terms Impressions Clicks Average Position In Search |
| Organic Social Media | Channel Followers Count Impressions Reach Actions/Engagement by post |
| Organic Video Marketing | Channel Followers Count Video Views Average length of video watched Actions/Engagement |
Marketing Data Analytics Tool
Every platform you use to market your business provides some level of data analytics to review. The downside is that you have to go from one platform to another to get to your data. It is extremely time-consuming to have to go from one platform to another in order to get a complete picture of marketing data analytics.
Using Google Data Studio to aggregate your high-level data and create a holistic report is the best way to quickly see all of your data and see how the different data fields relate to each other. To aggregate all the data from the different sources you will need a data aggregator inside of Google Data Studio. For our client reports, we use Supermetrics. We have found it is the simplest and most reliable data aggregator available. It’s also easy to set up and use on a day-to-day basis.
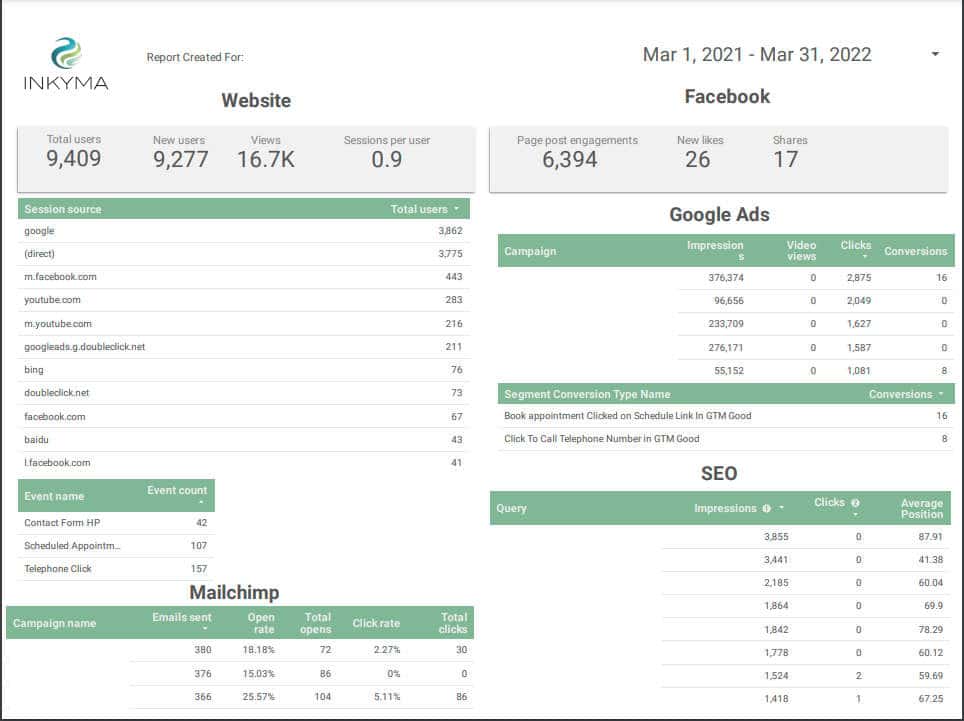
Supermetrics provides 70 plus connectors via Google Data Studio. They also provide a JSON/CSV/XML connector so you can create your own connection if one is not provided for a specific platform.
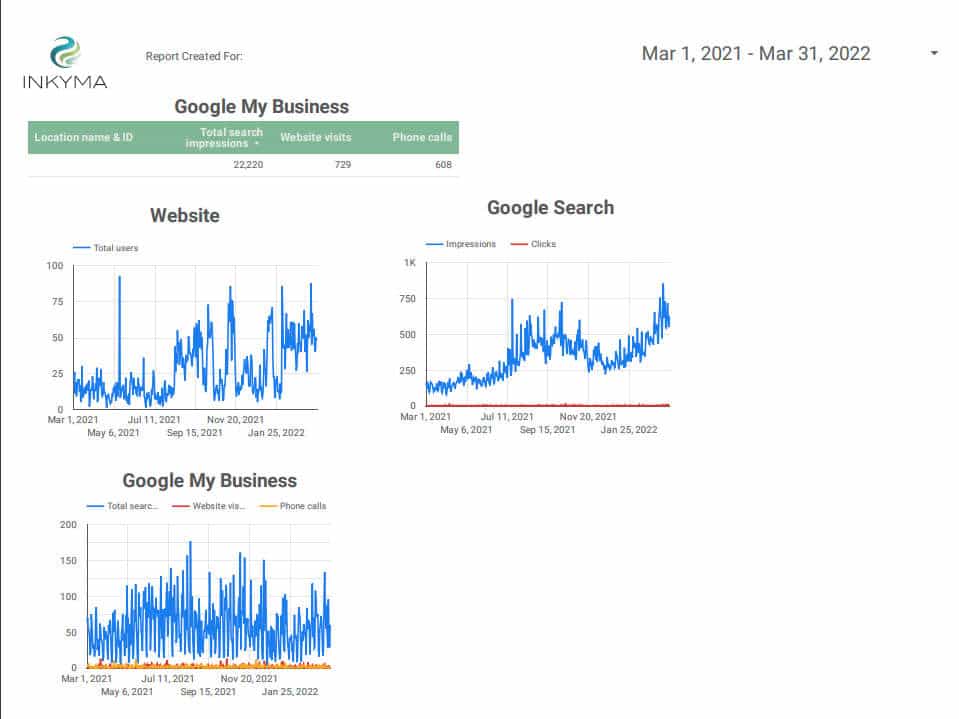
Once you have your Supermetrics connectors added to Google Data Studio you can then lay out your data on the report that works best for you. We recommend that you label each table based on your source and group like data together. group all of your organic data together and then group your paid advertising data.
You will want to see individual numbers but then also create graphs to see trends across time. All the data is live so you can look at smaller data for a month then expand out and looks at trends over 3, 6, or 12 months in graph form.
I hope you found this article helpful in securing your business so you can stay focused on your growth goal which always includes marketing. Feel free to reach out via chat if you have any questions. We are always happy to answer questions. If you want our content delivered to your inbox Sign up for our newsletter. You get great content and exclusive offers by being a member.
If you like this article, consider sharing it with other business owners you know. Use the sharing links below.